Nederlandse tekst niet beschikbaar
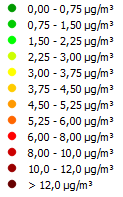
The following airQmap shows the average exposure of cyclists to traffic pollution (Black Carbon) on the street of Ghent.The most healthy cycle routes are depicted in green.
The map is based on BC measurements carried out by volunteers over a three week period. Measurements have been collected on three different routes between 8 en 9 AM, between 14 and 15 PM, and between 17 and 17.30 PM. The measured black carbon concentrations are averaged over street sections. They give an indication of the relative differences in BC concentrations encountered by the cyclists during their rides. These values cannot be generalised or extrapolated to other locations or other periods of the day or the year. Our current research insights indicate that the number of measurement trips collected in the Ghent measurement campaign is too limited to be able to guarantee the quality of the obtained results.
U kan deze kaarten in 3D bekijken op Google Earth. U kan de KML file downloaden van Gent.