The Dutch Longfonds, the European Lung Foundation, the European Respiratory Society and VITO worked together to create this air pollution exposure map of Amsterdam as an initiative for the ERS/ELF Healthy Lungs for Life campaign, looking at the importance of exercising in clean air. The airQmap below shows the average exposure of cyclists and pedestrians to air pollution (Black Carbon) during the day for the period May 26 till June 18 2015. The default map shows the average BC concentration of cyclists for each 20 meter road segment. Use the menu under the map to switch maps. The most healthy routes are depicted in green.
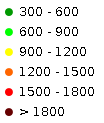
 This map has been constructed based on repeated mobile BC measurements by volunteers on bike and on food. 25 repeated measurement trips have simultaneous been conducted on bike and on food. The measurements trips are evenly spread over 4 weeks and over the hours of the day from 7h till 18h30. All measurements have been collected during working days. The measurement trips have always started form the Amsterdam railwaystation. The measurement route has a length of 10 km for the cyclists, and 5 km for the pedestrians. Each measurement trip required around one hour. The color scale used for the BC concentrations measured in Amsterdam differs from the other airQmaps and is shown here on the right (in ng/m3).
You can see this map in 3D on Google Earth. You can download the KML files for Amsterdam measurements by bike, and Amsterdam measurements on foot.