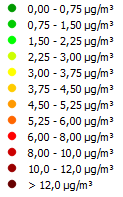
The city of Roeselare has mapped the Air Quality in Roeselare, together with citizens, using a mobile platform airQmap. The map shows the average BC (Black Carbon) concentrations in Roeselare:
- The map ‘Winter 2017’ shows the average BC concentrations during morning rush hour (7h30 – 8h30) and evening rush hour (16h30 – 17h30) on working days in the period 25/10 – 14/12/17.
- The map ‘Summer 2018’ shows the average BC concentrations outside rush hours (10h00 – 11h00 and 14h00 – 15h00) on working days in the period 20/06 – 6/07/18.
For each 20-meter road segment, the average BC concentration in µg/m3 is shown. The lowest concentrations are represented in green. The used color scale is described on the INFO page. The BC concentration gives the average exposure of cyclists at different locations in Roeselare.
This map has been realized based on mobile BC measurements collected by volunteers on a bicycle. The measurement track was about 10 km and comprises different environments i.e. busy roads, pedestrian streets, bicycle streets and school environments.
During the first measurement campaign (Winter 2017), measurements were performed during rush hours on working days. The aggregated map is the result of 26 repeated measurements. During the second measurement campaign (Summer 2018), measurements were performed outside rush hours on working days. The aggregated map is the result of 14 repeated measurements.
Repeated measurements are needed to obtain a representative image of the air quality differences in the city. Previous studies of VITO indicated that at least 25 repetitions are required to obtain acceptable results. Due to circumstances beyond our control, a limited number of runs (14) are available for the second campaign (summer 2018) and as a result, this map gives only an indication of the spatial variability but is less representative.
The map ‘Summer 2018’ shows lower concentrations compared to the map ‘Winter 2017’. The lower concentrations observed in summer are due to lower background concentrations and better dispersion conditions; the average BC concentration of all Flemish monitoring stations was lower during the Summer campaign (1,0 µg/m3) compared to the Winter campaign (1,9 µg/m3). In addition, measurements were performed at a different time of day resulting in lower concentrations and less variability in the summer campaign compared to the winter campaign; measurements of the summer campaign are performed outside rush hours, when there is less contribution of local traffic emissions in comparison to rush hours (when winter campaign measurements are performed).

