Black Carbon
AirQmap enables the construction of maps of the exposure of cyclists and pedestrians to Black Carbon (BC). Black Carbon is the combustion related component of particulate matter (fine dust). Traffic and heating are important sources of BC. There are indications of a link between exposure to black carbon and cardiovascular and cardiopulmonary health effects.
The World Health Organization indicates that “Studies of short-term health effects suggest that BC is a better indicator of harmful particulate substances from combustion sources (especially traffic) than undifferentiated particulate matter (PM) mass” [link].
Visual aids
A number of visual aids are available to allow to get a better view on the local situation. It is possible to zoom in on locations of interest with the mouse wheel and satellite pictures can be activated in the map selection menu. Also, you can virtually visit the measurement locations by activating Google StreetView, and clicking the location of interest on the map. When a boll is clicked in the Google Earth 3D visualisation, a number of basic statistics of the data collected on this location are shown.

Color scale
The color scale used on all airQmap is shown on the following figure. All BC measurements are in microgram/m3. The color scale shows the BC concentration typical for urban background locations in green (< 3 µg/m3), the BC concentrations typical for rural and urban hot-spot locations in red (> 6 µg/m3) and the BC concentrations in between in yellow and orange.

Influencing factors
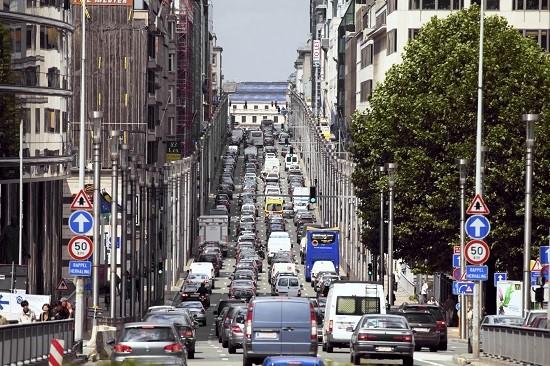
The BC concentration to which bikers are exposed in a street depends on different factors. The most important are:
- Traffic intensity: The amount of traffic in the street.
- Traffic mix: The percentage trucks, busses, motorcycles, diesel and gasoline cars of which the traffic in the street is composed.
- Presence of a bike lane: Bikers are less exposed in streets where a bike lane is present compared to streets where they have to drive between the cars.
- Distance between the bike lane and the road: The farther the bike lane is from the road, the lower the exposure.
- Presence of terraced housing: It is harder for pollutants to be blown away by the wind in streets with terraced housing.
- Presence of high buildings: The higher the buildings in the street the longer the pollutants can stay present in the street.
- Width of the street: Pollutants will leave the street faster in a wide street.
- Orientation of the street in relation to the dominant wind direction: Pollutants are removed faster in streets which follow the dominant wind direction.
- Slope of the street: Motorized traffic will have to open the throttle more on streets with a large slope. This has a negative impact on the air quality.
- Presence of tunnels and long bridges: Pollutants stay longer present in tunnels and underneath long bridges. A build-up of pollutions can happen on those locations.
- Presence of road crossings, traffic lights, and speed bumps: Traffic has to brake and accelerate at road crossings, traffic lights, and speed bumps. This has a negative impact on the air quality in the street.