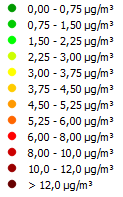
Following airQmap shows the aggregated Black Carbon exposure map of 20 repeated measurement trips by bike in Mol. The measurements have been collected over a period of two and a half week (07/04/2010 - 23/04/2010). All measurement trips have been done during the day (10h - 17h).
You can see this map in 3D on Google Earth. You can download the KML files for Mol.