Context
AirQmap is a powerful platform which allows people with limited or no air pollution expertise, such as city personnel or volunteers, to carry out air quality measurements and to get a detailed view on the air quality at street level. This approach allows to produce air quality maps at a feasible cost for cities and municipalities.
Cyclists (and pedestrians) are exposed to traffic pollution while moving around in city centers and urban environments. Their level of exposure can differ significantly from street to street. Fixed monitoring networks offer high quality data, but are unable to offer detailed street level exposure information. On the other hand, air quality models are able to offer detailed exposure information, but are often complex and require high-quality, up-to-date input data (e.g. detailed traffic situation, street composition, weather conditions, ...) which is not always available. With airQmap detailed exposure maps are produced based on mobile air quality measurements by cyclists or pedestrians. They allow to take the numerous influencing factors into account while offering a high level of detail.

Measuring exposure to Black Carbon
AirQmap measures the exposure of cyclists or pedestrians to Black Carbon (BC). Black Carbon (BC) is the combustion related ‘soot’ component of particulate matter. The most important sources of BC are traffic and domestic heating. Exposure to black carbon is associated with cardiovascular and pulmonary diseases. BC is recognized by the World Health Organization (WHO) as a better indicator of harmful particulate substances from traffic than undifferentiated particulate matter (PM) mass [link]. Therefore BC is a highly suitable component for drawing traffic pollution exposure maps.
AirQmap uses repeated mobile air quality measurements. Due to both large spatial and temporal variations in BC exposure levels, repeated measurements have to be conducted. To determine the average BC exposure level 20 to 30 repeated measurements are required for most streets, for each time interval of interest, on 10 different days. To collect the required BC measurements in a cost effective way we cooperate with city personnel, people who are professionally cycling or walking through the streets, or volunteers. In so-called opportunistic measurement campaigns they collect measurements while commuting or while conducting daily duties on the streets. This type of measurements is opportunistic because it is largely uncoordinated. In targeted measurement campaigns they are asked to conduct measurements on a well-defined trajectory at certain hours of the day. With targeted measurements exposure levels on streets of interest can be mapped in a relative short time frame of a few weeks.
How it works
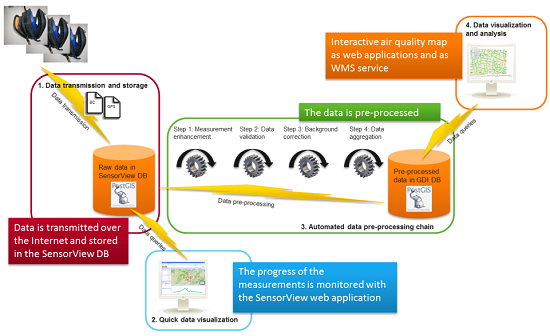
AirQmap allows people with limited or no air pollution expertise to collect mobile BC measurements and processes them into street-level BC exposure maps. It contains two parts: the first part is formed by easy to use measurement devices. This includes compact BC monitors, GPS and netbooks with software to transmit data and synchronize instruments. All the equipment is provided, a short training on their use and instructions on how to collect the data to get a reliable result. The second part is an automated data processing infrastructure, shown in the figure on the left, which constructs and updates the BC map. Processing steps include enhancement and validation of noisy second BC measurements and distorted GPS tracks (due to reflection of the GPS signal on high buildings), background correction and spatiotemporal data aggregation.
Obtained results
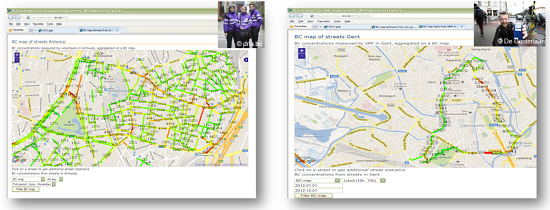
AirQmap provides an interactive map that can be consulted through the web. The web application gives access to a zoomable map and allows to select different background maps and a 3D visualisation. The level of detail can be changed from 50 m to street section level. Details can be consulted for the individual measurement points. Each measurement location can be visualized through Google StreetView.
AirQmap has been successfully used in cities such as Antwerp, Ghent, Brussels, Liege, Amsterdam and Oslo, and in Belgian municipalities such as Mol, Beringen and Zutendaal. Some of the resulting on-line maps can be consulted on this website. The results of an experimental opportunistic measurement campaign by Antwerp city guards are available here.
AirQmap is based on sound scientific work which has been published by VITO in following scientific papers:
- Van den Bossche et al., Mobile monitoring for mapping spatial variation in urban air quality: Development and validation of a methodology based on an extensive dataset, in Atmospheric Environment, Volume 105, March 2015, Pag. 148-161 [link]
- Peters et al., Cyclist exposure to UFP and BC on urban routes in Antwerp, Belgium, in Atmospheric Environment, Volume 92, August 2014, Pag. 31-43 [link]