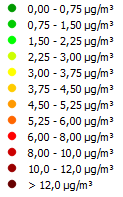
The airQmap below shows the average exposure of bikers to air pollution (Black Carbon) during the day for the period January 21 till March 2 2015. For each 20 meter road segment the average BC concentration is given. Only road segments for which sufficient measurements have been collected are shown. The most healthy bike routes are depicted in green. Information about the used color scale is available on the INFO page.
This map has been constructed based on repeated mobile BC measurements by volunteers on bike. 10 repeated measurement trips have been conducted in the morning (9h – 12h), in the afternoon (13h30 – 16h30) and in the evening (17h – 20h). 30 times in total has the same measurement trip been done, always during the working week. The measurement trips start form the Beringen city hall and have always been executed clockwise. The measurement route has a length of 30 km. Around 3 hours are required to do the measurement trip once with a speed of 10 km/h.
You can see this map in 3D on Google Earth. You can download the KML file here for Beringen.