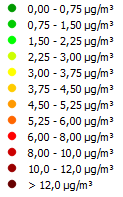
The airQmap below shows the average concentrations BC (Black Carbon) in Kortrijk during morning and evening rush hour for the period January 18 2016 – February 16 2016. For each 20 meter road segment, the average BC concentration is given in µg/m3. The lowest concentrations are depicted in green. Information about the used color scale is available on the INFO page. The shown BC concentrations are the average exposure of cyclists on different locations in Kortrijk.
This map has been constructed based on mobile BC measurements of volunteers by bicycle. The map bellow shows the aggregated results of 36 measurement trips over the same 13 km route. 18 of the trips have been done during morning rush hour (7h30 – 8h30), and 18 trips during evening rush hour (16u30 – 17u30). Measurements have only been collected on weekdays. Each trip started at the Kortrijk city hall and was done clockwise.
Repeated measurements are needed to get a representative image of the air quality in the city. Former studies of VITO indicate that a minimal number of 25 measurements is required to obtain acceptable results.
You can see this map in 3D on Google Earth. You can download the KML files for Kortrijk.